
这是一个创建于 1820 天前的主题,其中的信息可能已经有所发展或是发生改变。
原文发布在Easton Man's Blog
Perf 是一个性能分析工具,自从 Linux 2.6.31 ( 2009 年)以来就被加入了内核。它利用内核运行时插桩的方式检测程序的运行,可以提供相当丰富的信息,足以让我们找到程序运行中的性能瓶颈和优化重点。
安装
在某些系统中可能有预装完整的 Perf,但是在我所使用的 Debian Buster ( 10 )上,只有用户空间的程序被预装了,所以还需安装对应的内核工具。通常来说,以下的这一条命令可以安装对应内核版本的 Perf 内核部分。但是如果此时正在使用的内核不是 apt 中最新的内核,则需要重启以切换到新的内核,或者安装指定版本的 Perf 内核工具。
sudo apt install linux-perf
sudo apt install linux-perf-5.8 # 指定内核版本
此时我们应该已经可以运行 perf 了,但是通常会出现以下的结果:
$> perf record
Error:
You may not have permission to collect stats.
Consider tweaking /proc/sys/kernel/perf_event_paranoid:
 -1 - Not paranoid at all
  0 - Disallow raw tracepoint access for unpriv
  1 - Disallow cpu events for unpriv
  2 - Disallow kernel profiling for unpriv
或者说这样
Plain text
Error:
Access to performance monitoring and observability operations is limited.
Consider adjusting /proc/sys/kernel/perf_event_paranoid setting to open
access to performance monitoring and observability operations for processes
without CAP_PERFMON, CAP_SYS_PTRACE or CAP_SYS_ADMIN Linux capability.
More information can be found at 'Perf events and tool security' document:
https://www.kernel.org/doc/html/latest/admin-guide/perf-security.html
perf_event_paranoid setting is 3:
  -1: Allow use of (almost) all events by all users
      Ignore mlock limit after perf_event_mlock_kb without CAP_IPC_LOCK
>= 0: Disallow raw and ftrace function tracepoint access
>= 1: Disallow CPU event access
>= 2: Disallow kernel profiling
To make the adjusted perf_event_paranoid setting permanent preserve it
in /etc/sysctl.conf (e.g. kernel.perf_event_paranoid = <setting>)
这是因为出于安全考虑,内核在默认情况下禁止非特权用户监测系统性能。解决的办法有以下几种:
- 修改 kernel.perf_event_paranoid 内核参数
- 给 perf 加入 CAP_PERFMON 权限位
- 使用 root 用户进行性能监测
我自己一般使用第一种,因此介绍第一种方法的详细做法。不推荐使用 root 用户运行 perf,因为这样可能会有安全隐患。
修改 kernel.perf_event_paranoid 参数有两种做法。第一种方法是临时的,重启后就失效了,但是快速一点
sudo sh -c "echo -1 > /proc/sys/kernel/perf_event_paranoid"
或者使用 sysctl 命令
sudo sysctl -w kernel.perf_event_paranoid=-1
EnlighterJS Syntax Highlighter
第二种方法是修改 sysctl 的配置文件,在我的环境中,这个文件位于 /etc/sysctl.conf,有的系统中会使用 /etc/sysctl.d
Generic Highlighting
sudo sh -c 'echo "kernel.perf_event_paranoid=-1" >> /etc/sysctl.conf'
sudo sysctl -p
这样操作完成以后,内核就会允许非特权用户使用 perf 内核部分中的接口了。
使用
perf 有几种常用的使用方式,第一种是较为简单的粗略了解程序使用硬件的情况
$> perf stat ls

<stdout>

Performance counter stats for 'ls':

              1.87 msec task-clock                #    0.411 CPUs utilized
                11      context-switches          #    0.006 M/sec
                 0      cpu-migrations            #    0.000 K/sec
                94      page-faults               #    0.050 M/sec
         2,771,746      cycles                    #    1.479 GHz
         1,534,926      instructions              #    0.55  insn per cycle
           317,631      branches                  #  169.519 M/sec
            15,169      branch-misses             #    4.78% of all branches

       0.004553499 seconds time elapsed

       0.003498000 seconds user
       0.000000000 seconds sys
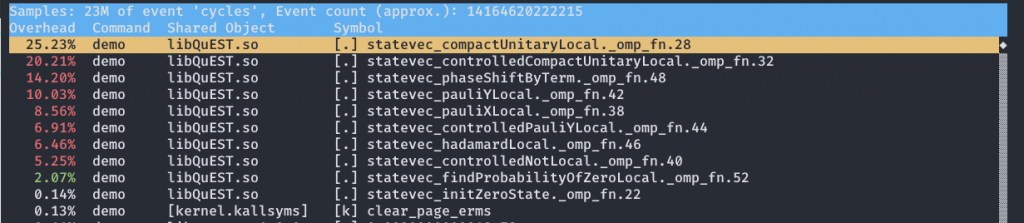
第二种也是功能强大的一种,可以详细分析程序各函数的运行时间占比,还可以查看这些函数中各个指令的耗时占比,这使得我们可以精确地了解程序运行时的瓶颈的处理器资源使用情况。
perf record <program>
perf report
这时我们就可以看到类似这样的界面
 此时按下 A 可以看到反汇编后的汇编代码和相应的时间占比。
有的时候如果编译时关闭了 debug 选项(如 gcc -g )那么 perf 很可能不能得到正确的调用栈,这样时间占比的统计就会有问题,不利于我们观察热点函数,此时可以指定 perf 使用更详细的调用栈跟踪方法,例如使用 lbr
perf record --call-graph lbr <program>
perf 可以使用的调用栈跟踪方法有三种:
- fp:最不详细,产生的记录文件也最小,对程序的性能几乎无影响。
- lbr:较为详细,产生的记录文件显著增大,对程序的性能有少量的影响。
- dwarf:最详细,产生的记录文件极其巨大,1 分钟可能能记录 10G,对程序性能有显著影响,因此并不很实用。 对我来说一般直接选择 lbr 就可以了,如果硬盘不够大或者读写几个 G 的文件很慢的话再考虑 fp 。
这几种调用栈跟踪方式的详细区别可以参考大神博客
深入阅读
Investigating Linux Performance with Off-CPU Flame Graphs
 |
1
liuguangxuan 2021 年 2 月 17 日
你这是在干啥
|
 |
2
hxndg 2021 年 2 月 20 日
你可以再深入一些,
比方说 CPU 密集型进程怎么找到热点? 火焰图? 怎么分析系统调用? |
